By Shash7. Posted under guides Posted on 8th Jul, 2025
Back to Articles 
How to Measure Advertising Effectiveness: Tips & Strategies
Contents
 Try Swipekit
 What does "measuring advertising effectiveness" mean? It’s about seeing how well your ads make people act and reach your goals. It moves past counting eyeballs and looks at the direct impact on clicks, leads, and sales. You need to know your ad spend brings a positive return.
Moving Beyond Outdated Advertising Metrics
For decades, proving an ad worked was more gut feeling than science. Marketers used broad, fuzzy measures to guess success. Old-school TV and print ads had tracking methods from an era when you could not measure precisely. This left a big gap between spending money and knowing if it worked.
Believe it or not, many businesses still focus on those old metrics. They show how many people could have seen your ad but not who actually noticed it or what they did next.
The Problem with Traditional Reach Metrics
In the past, ad effectiveness often used metrics like Gross Rating Points (GRP) for TV ads. It counted viewership when an ad aired, giving a rough idea of households reached. In print, success was about circulation and magazine sales. These numbers show potential reach but miss if anyone paid attention or was persuaded. Learn more about these limits in this detailed overview.
An ad could air during the biggest show on TV, but viewers might be in the kitchen grabbing a beer or scrolling on their phones. A full-page magazine ad? It might get flipped past. The metrics show reach but miss engagement and real impact.
The biggest flaw in old-school ad measurement is confusing opportunity with action. Just because an ad was in front of someone doesn’t mean it made them think, feel, or do anything. True effectiveness is about causing a change, not just being present.
Shifting Focus from Reach to Results
To measure ad effectiveness, look past surface numbers. Focus on strategies to improve marketing ROI. The modern way is not about eyeballs you might have reached; it’s about tracking the actions your ads cause.
Ask better questions:
-
Did people click through to our website from the ad?
-
Did we get any qualified leads for the sales team?
-
Can we trace any sales back to this campaign?
-
Is this ad changing how people see our brand?
You’re not just buying media space anymore; you’re investing in outcomes you can measure. For example, show a unique URL on your TV ad and track exactly how many viewers type it in.
This shift turns ads from a cost center into a performance investment. Every dollar ties to a real result, letting you tweak and improve. By finding which ad creative gets the most conversions, you can sharpen your message and visuals. You can also use A/B testing to pit ad versions against each other. If you’re new, check out how to run effective A/B tests. When you focus on action, you build a smarter, more accountable ad strategy.
Connecting KPIs to Your Campaign Goals
Before measuring, decide what "success" looks like for your campaign. Trying to track every metric leads to overwhelm.
Tie specific Key Performance Indicators (KPIs) to your goals. This gives a clear line from strategy to results.
You wouldn’t time a sprinter's 100-meter dash with a calendar. Goals need matching metrics. Metrics for brand awareness are noise in a sales campaign.
Getting this right is the first critical step. With a clear destination, choosing the right KPIs is easier.
A simple dashboard concept can help visualize how metrics like Click-Through Rate (CTR), Cost Per Acquisition (CPA), and Return on Investment (ROI) come together.
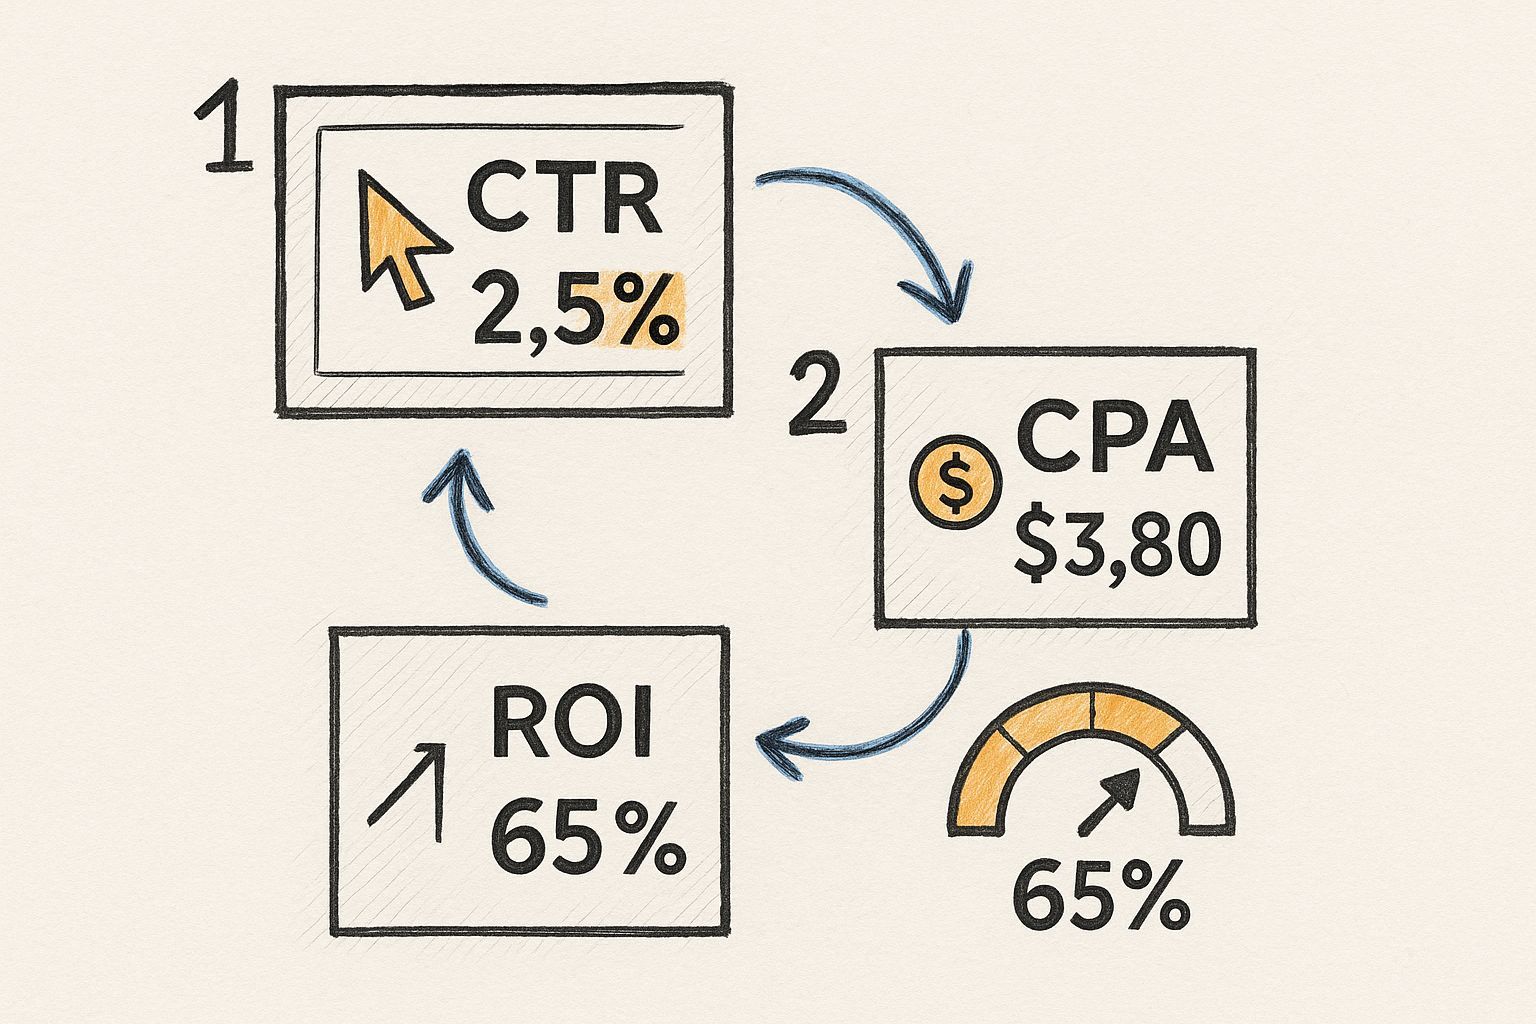
It helps you see how data points connect to tell the full story of your ad performance.
Here’s a quick-reference table to match goals to the right metrics.
Matching Campaign Goals to Key Performance Indicators
Campaign Goal Primary KPIs What They Tell You
Brand Awareness Impressions, Reach, Video View Rate How many people are seeing your brand and how visible you are.
Engagement CTR, Likes, Comments, Shares, Time on Page If your content is interesting enough to make people interact with it.
Lead Generation & Sales Conversion Rate, CPL, CPA, ROAS How efficiently you're turning clicks into leads and paying customers.
Aligning KPIs with Brand Awareness Goals
If your goal is brand awareness, focus on reach and recognition, not sales. You want to plant a flag with a new audience or stay top-of-mind.
For a top-of-funnel push, track:
-
Impressions: The raw number of times your ad was shown. It’s your basic visibility score.
-
Reach: How many unique people saw your ad. This shows how wide your net was.
-
Video Views and View-Through Rate (VTR): For video, a high VTR means your creative holds attention.
-
Share of Voice (SOV): This compares your brand’s visibility to competitors. Are you a whisper or a shout in your market?
These metrics focus on presence. They won’t show immediate purchase intent but lay the groundwork for conversions. No awareness, no sales.
Choosing Metrics for Engagement Campaigns
Once people know you, you want them to interact. Engagement campaigns build relationships and start conversations.
Use KPIs that reflect interaction:
-
Click-Through Rate (CTR): The percentage of people who saw your ad and clicked. A high CTR shows your creative and call-to-action work.
-
Likes, Comments, Shares: Social proof that your content resonates.
-
Time on Page: If your ad sends traffic to a landing page, longer time means genuine interest.
An engagement campaign that gets a ton of likes but zero clicks to your site isn't a failure—it’s a lesson. It tells you your content is thumb-stopping, but your call-to-action might be weak. Every KPI gives you a piece of the puzzle.
Tracking Lead Generation and Sales
For leads or sales, use KPIs focused on revenue. This shows how hard your ad dollars work.
Track:
-
Conversion Rate: The percentage of users who did the action you wanted after clicking.
-
Cost Per Lead (CPL): The average cost to get one new lead.
-
Cost Per Acquisition (CPA): The cost to get a paying customer.
-
Return On Ad Spend (ROAS): For every dollar spent, how many dollars in revenue you get back.
To dial in, understand key customer metrics like CSAT and NPS. This measures sentiment, not just actions.
Using Digital Tools for Causal Measurement
Digital ads let you draw a straight line from an ad to action. This moves you past correlation to proving causation. You can run tests to see how ads change behavior. It’s a big step from guesswork to tracking the entire customer journey.
Embracing Controlled Experiments
The best way to know an ad’s real impact is a controlled experiment. Think of it as a science fair project for marketing. You can use A/B testing or control groups.
With A/B testing, you test two ad versions against each other. Show versions to similar audiences. The data shows which creative gets more clicks or conversions. It leaves no guessing.
Control groups take it further. Show your ad to one segment (exposed) and hide it from a similar group (control). Comparing groups gives the ad’s direct effect. If the exposed group buys more, your ad caused that lift.
The big idea behind causal measurement is simple: to know if your ad caused a sale, you have to know what would have happened if no one ever saw the ad. A control group gives you that baseline.
Understanding Key Digital Metrics
To run these tests, learn core digital metrics. They tell the story of your ad performance.
-
Click-Through Rate (CTR): Percentage of people who saw your ad and clicked. It indicates if creative and copy are strong.
-
Conversion Tracking: Watches what people do after clicking. A conversion is any action you want them to take. Tools like the Meta Pixel or Google Ads tags enable this.
-
Attribution Modeling: Assigns credit to each touchpoint for a sale. It helps you see if a customer saw an Instagram ad, clicked an email, and read a blog post before buying.
These metrics work together. A high CTR is useless if clicks don’t turn into sales. And for video campaigns, learning about video marketing analytics is crucial.
Putting It All Together: A Real-World Scenario
Say you sell custom phone cases and run an Instagram campaign. Set up an A/B test. Ad A is a static image; Ad B is a short video. You track conversions.
After a week, you see:
-
Ad A (Image): 1.5% CTR, 50 sales.
-
Ad B (Video): 3.2% CTR, 120 sales.
The video ad got more clicks and twice the sales. Now you know video works better for your audience and can put more budget behind it. Digital ads use exposed and control groups to measure direct effects. This method is everywhere, since digital ad spend is over 60% of total budgets.
Another key piece is ad frequency. Too little reach and it won’t stick. Too much and you annoy people. Learn more about optimizing ad frequency. By pairing smart experiments with diligent tracking, you can answer "Did my ad work?" with confidence.
Uncovering the 'Why' with Qualitative Feedback
Digital metrics tell you what happened but not why. Qualitative feedback gives the human story behind the numbers. Data might show an ad generated leads, but not if the message resonated. To get the full picture, add the human element. It’s the difference between following a path and understanding the journey.
Using Surveys to Measure Brand Impact
Surveys are a direct way to see what people think after an ad. They measure things analytics can't.
Use surveys to measure:
-
Brand Awareness: Do people recognize your brand after the campaign?
-
Ad Recall: Can they remember seeing your specific ad?
-
Brand Perception: Did the ad change how they feel about you?
-
Purchase Intent: Are they more likely to buy now?
These questions give a richer view of your ad’s performance. You’re not just counting actions; you’re measuring influence.
A key goal of any brand measuring ad effectiveness is to move beyond simple behavioral metrics toward a more complete solution. Surveys are your bridge from "what they did" to "why they did it."
The Power of Control vs. Exposed Tests
A key survey method is the control vs exposed test. You survey two similar groups; one saw the ad (exposed) and one did not (control). Comparing answers shows the ad’s impact. This reveals if ads reached the right people and if they changed perceptions or moved consumers down the funnel.
For example, 55% of your exposed group says they’re likely to purchase, while only 25% of the control group says the same. That’s a 30% lift you can directly tie to your ad.
If you want to dive deeper into this methodology, GWI has some in-depth analysis on advertising effectiveness worth checking out.
Crafting a Survey That Gets Real Answers
Good insights need good questions. To get useful feedback, design surveys well.
-
Keep it simple and clear. Use plain words.
-
Ask one thing at a time.
-
Use multiple choice for easy data and open-ended for personal insight.
-
Be neutral. Don’t lead respondents. Instead of "How much did you love our new ad?" ask "What did you think of our new ad?"
Combining human insights with data gives a full view of your campaign’s performance.
Choosing the Right Ad Measurement Tools
The right tools turn data into clear insights. You don’t need a big budget. Start with basics, then add advanced tools as your campaigns grow.
Start with Your Native Analytics Platforms
First, use built-in analytics in your ad platforms. These give basic performance data fast.
Key native tools:
-
Google Analytics 4 (GA4): Tracks what happens after the click. Shows traffic sources, page views, and actions on your site.
-
Ad Platform Dashboards: Facebook Ads Manager, Google Ads, LinkedIn Campaign Manager, TikTok Ads Manager. They show real-time metrics like impressions, CTR, and CPA.
These tools connect directly to your campaigns. Master them first.
Think of your native analytics as your daily dashboard. It gives immediate feedback you need to make quick tweaks. Costs creeping up? CTR taking a nosedive? You’ll spot those trends here.
When to Consider Specialized Third-Party Tools
Native analytics live in silos. Facebook knows Facebook results, Google knows Google results, but it’s hard to get a unified view. That’s where third-party tools help.
They pull data from all sources and stitch it together. You get a holistic view of your ad effectiveness and can answer tough cross-channel questions.
Cross-Channel Attribution Tools These connect data across social, search, email, and more to show what really drives conversions. They move past last-click attribution. For example, a customer may see your TikTok ad, search your brand on Google later, and buy after clicking an email link. Attribution tools assign proper credit to each touchpoint. To learn more, check out marketing attribution.
Competitive Intelligence Tools Tools like Swipekit let you see competitor ad creative, messaging, and frequency. You can benchmark your performance and find new test ideas. It helps you know what works in the broader market, not just in your own campaigns.
By using native platforms and specialized tools, you get quick feedback and deep insights. That dual approach lets you react to daily trends and make smart long-term decisions.
Common Questions About Ad Measurement
You will have questions as you measure ad performance. This is your quick cheat sheet.
How Long Should I Wait to Measure Results?
It depends on your sales cycle and campaign goal. There’s no magic number.
If you sell simple products, people often buy the same day. You can check results in a few days or a week.
For big campaigns or expensive products, give it weeks or even a month to see brand lift or eventual sales.
What Is the Most Important Metric to Track?
There’s no magic metric. The most important one ties directly to your campaign goal. Tracking the wrong metric is like using a yardstick to measure weight.
Think about your objective:
-
Selling stuff? Track Return On Ad Spend (ROAS). It shows money in vs money out.
-
Building brand awareness? Focus on reach, impressions, and share of voice.
-
Generating leads? Watch Cost Per Lead (CPL). It tells you how much it costs to get a lead.
Match your measurement to your mission. Before spending, know what counts as a win. If you need a refresher, check different types of a campaign objective, then refine who you score against with purchase intent.
Can I Measure the Effectiveness of Offline Ads?
Yes, you can track offline ads like billboards or TV spots. It takes a different playbook.
-
Vanity URLs: Use a unique URL for that ad. Traffic there shows ad action.
-
Unique Promo Codes: Offer a code only in that ad. Each use is a conversion.
-
QR Codes: Link offline ads to a digital landing page or special offer.
You can also run brand lift surveys in areas where your ads run. Ask people before and after the campaign to measure changes.
Ready to stop guessing what works and start seeing the ad strategies your competitors use? Swipekit gives you the intelligence you need to make data-driven creative decisions. Spy on competitor ads, track their campaigns, and save great ideas using advertising competitive intelligence and competitor ad analysis.
Read more


Upgrade your creative workflow
Save winning ads from every major library, keep the full context, and turn scattered inspiration into reusable creative direction.
Start free trial
AG1 by Athletic Greens
Saved over 1 year ago
Meet Your New Supplement Routine ✅
Feel Reformed
Saved about 2 months ago

Upgrade your Matcha

HEC Wellness Center
Saved about 2 months ago

AG1 by Athletic Greens
Saved over 1 year ago
Meet Your New Supplement Routine ✅
Feel Reformed
Saved about 2 months ago
Upgrade your Matcha
HEC Wellness Center
Saved about 2 months ago